A wide use of fluorozirconate glass fiber has aroused significant interests for its operation in defense, medical, processing, scientific research, and mid‐infrared amplifiers. However, the attenuation of fluoride glass fiber is much higher than the corresponding theoretical value owing to poor glass-forming ability of the precursor glass.
In general, the improvement of glass formation can be achieved by introducing additional components of the partial or complete substitution of cations or halide ions into the glass system. Unfortunately, there is no suitable method to optimize the glass-forming ability of fluoride glass without affecting other properties.
Recently, a research team led by Professor ZHANG Long from Shanghai Institute of Optics and Fine Mechanics of the Chinese Academy of Sciences, has found an easy method to improve glass-forming ability of fluorozirconate glass by doping of lithium. The result was published in Ceramics International.
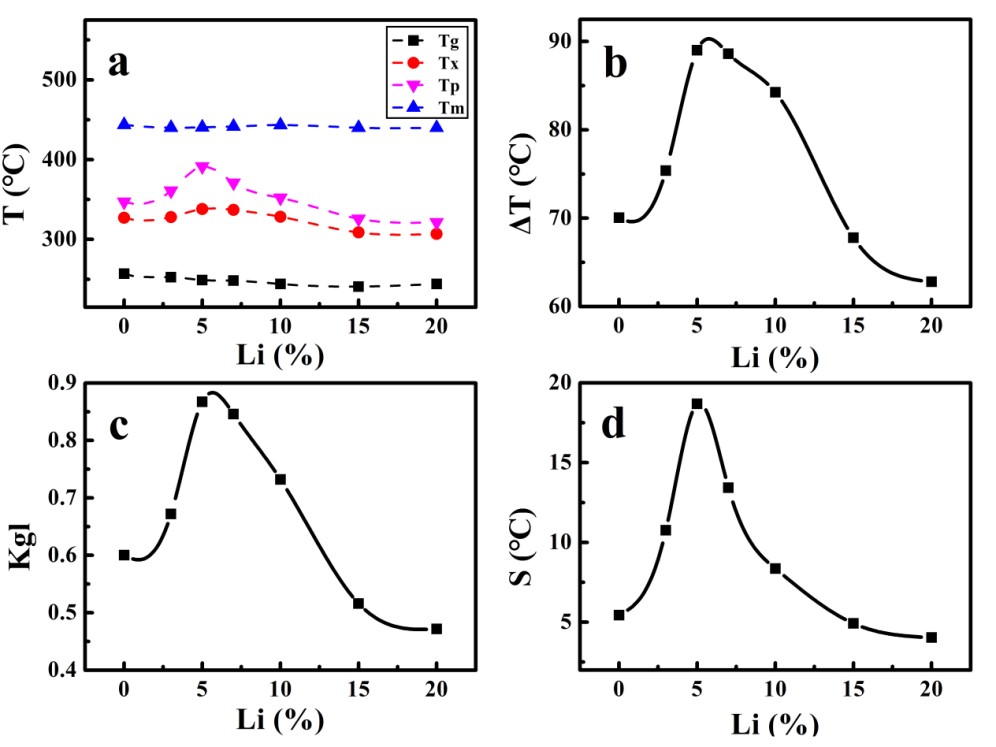
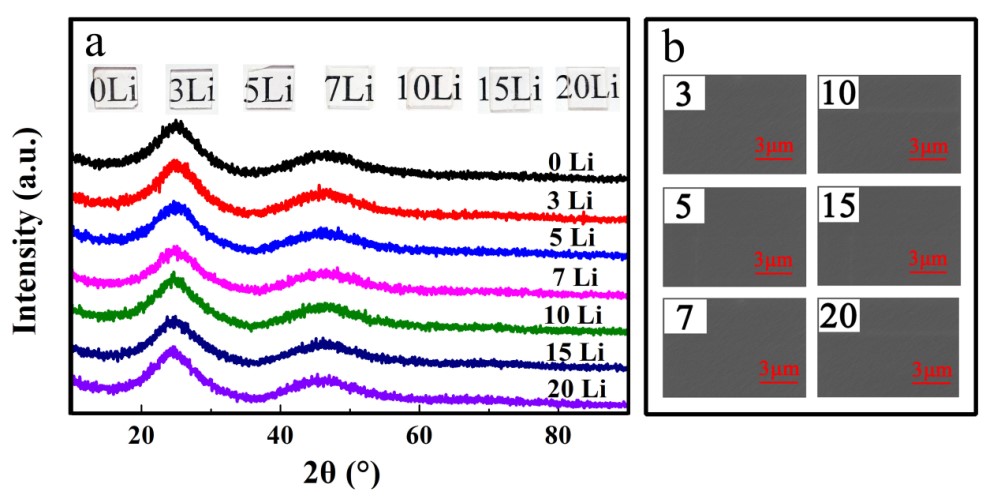
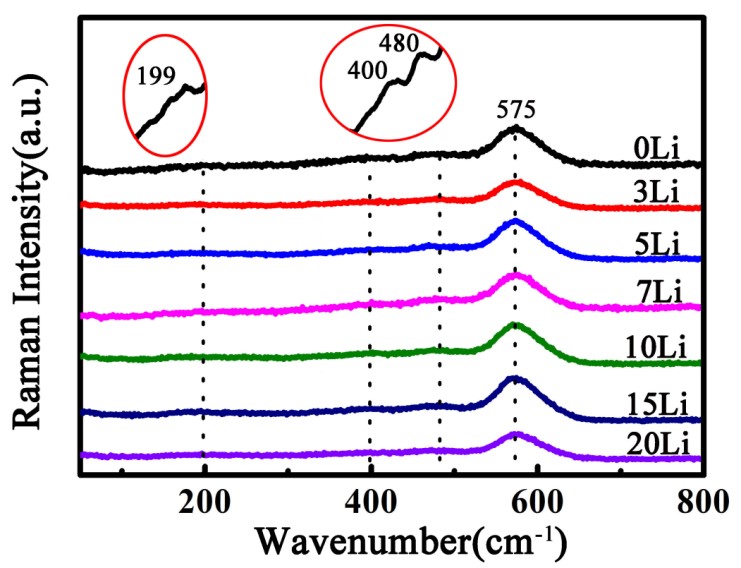
Their experiment was inspired by mixed alkali effect, replacing sodium with lithium to improve glass-forming ability of fluorozirconate glass. In their study, they discovered the optimal thermal stability of fluorozirconate glass when 5mol% Na+ was substituted for Li+. Three stability criterions were used to verify this result. The structure of Li+ doping glass was analyzed by SEM, XRD and Raman spectra, which showed that the glass network structure did not change with an increase of Li+.
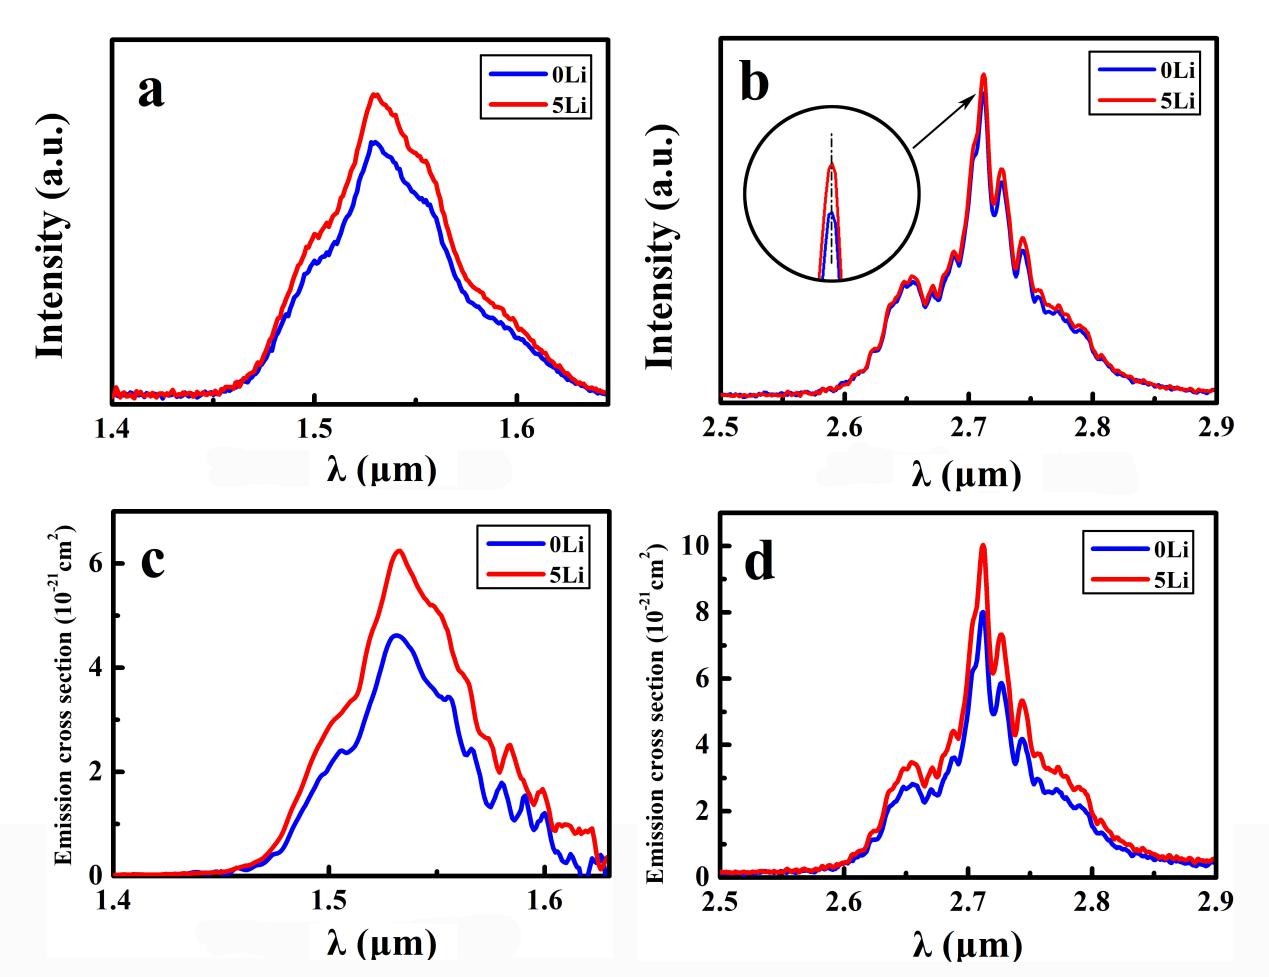
Furthermore, Judd–Ofelt (J–O) theory was applied to evaluate the fluorescence of the glass after modification, indicating that the doping of Li+ could enhance the fluorescence of fluoride glass.
This research could provide a new method to upgrade the glass-forming ability of fluoride glass.

Figure 1. (a) DTA results for all samples and (b)-(d) plots for ΔT, Kgl, and S parameters of the glasses as functions of lithium concentration (Image by SIOM) 
Figure 2. (a) XRD patterns of all samples (b) SEM of the modified samples (Image by SIOM) 
Figure 3. Raman spectra of samples (Image by SIOM) 
Figure 4. Fluorescence spectra of samples (Image by SIOM)
Article website: https://doi.org/10.1016/j.ceramint.2019.08.119
Contact:
Mr. Cao Yong
General Administrative Office
Shanghai Institute of Optics and Fine Mechanics, CAS
Email: caoyong@siom.ac.cn